Reporting Examples
Dashboards
Matrix Chart
Reporting
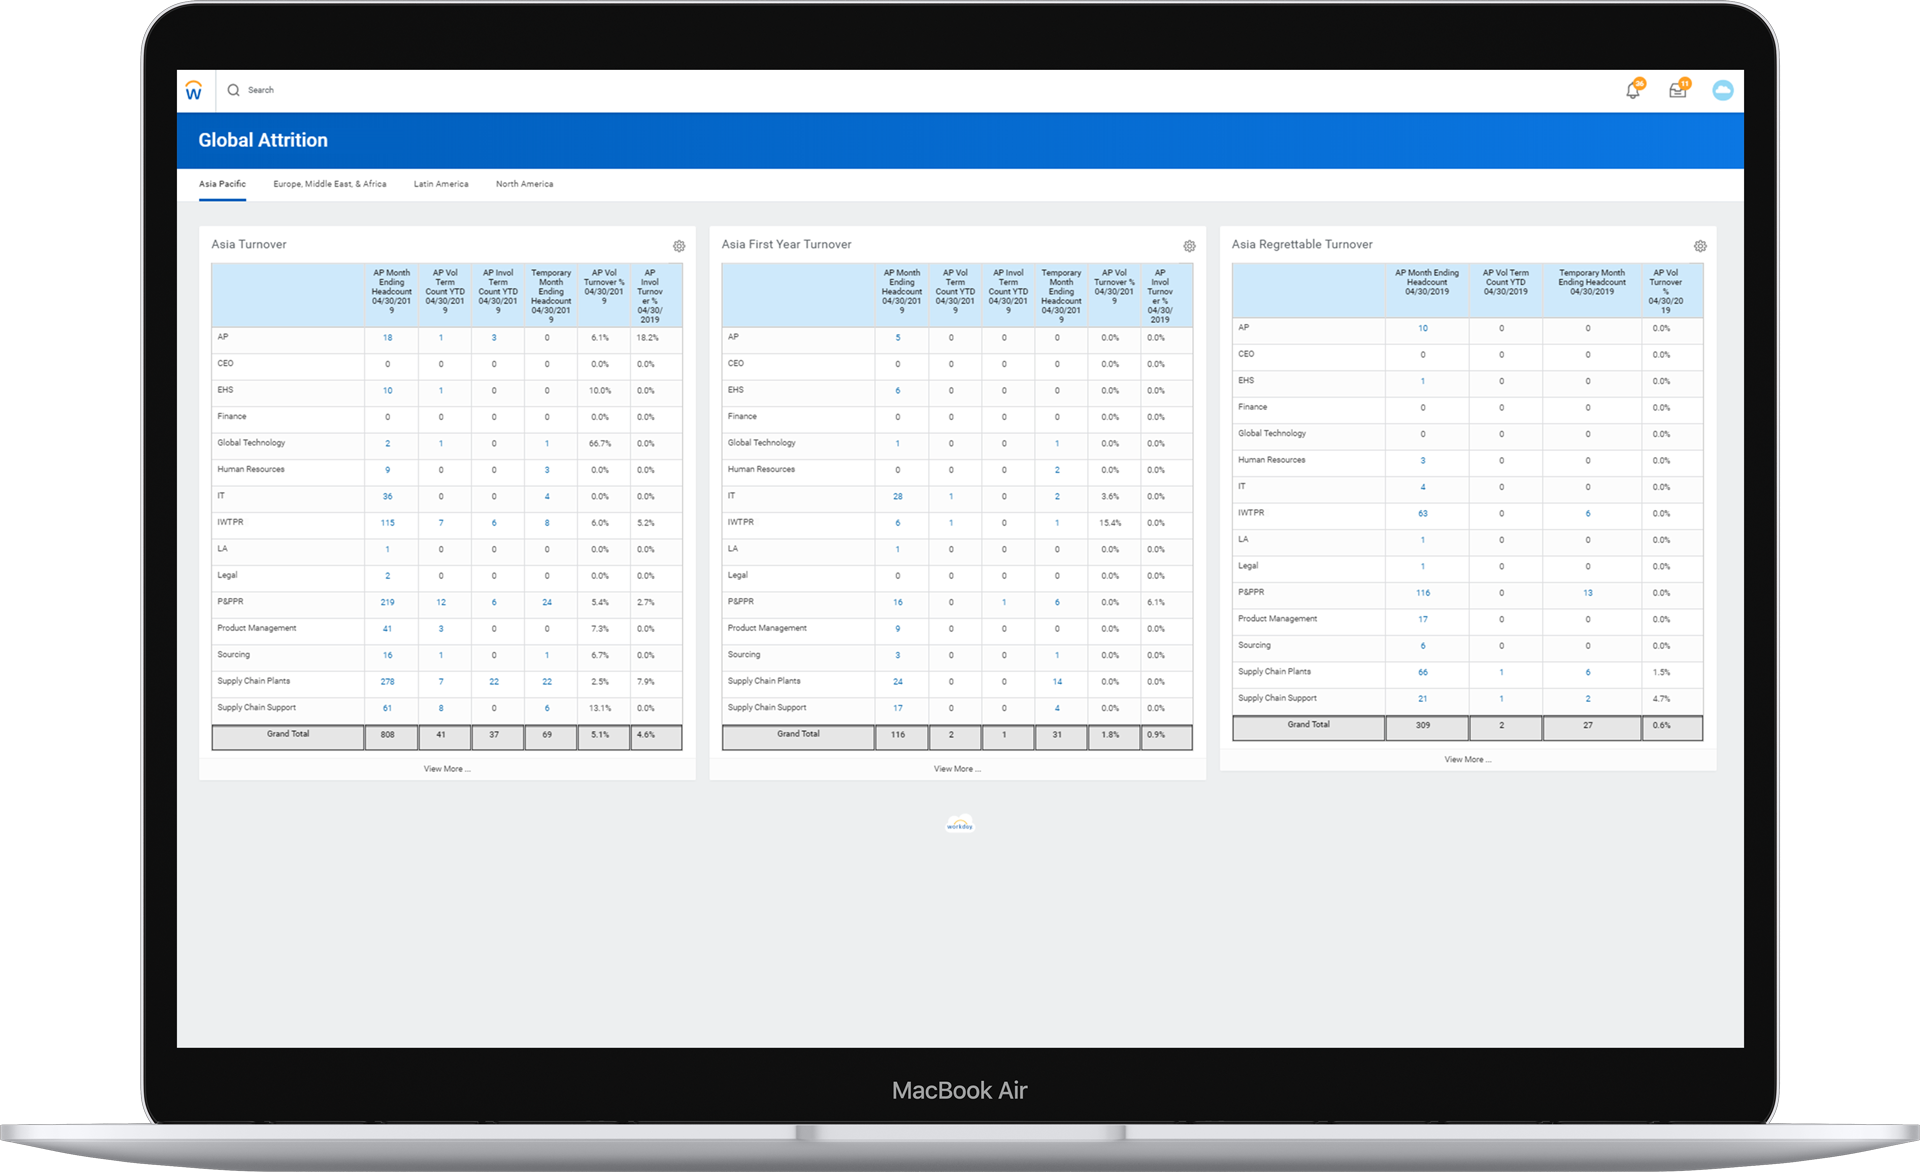
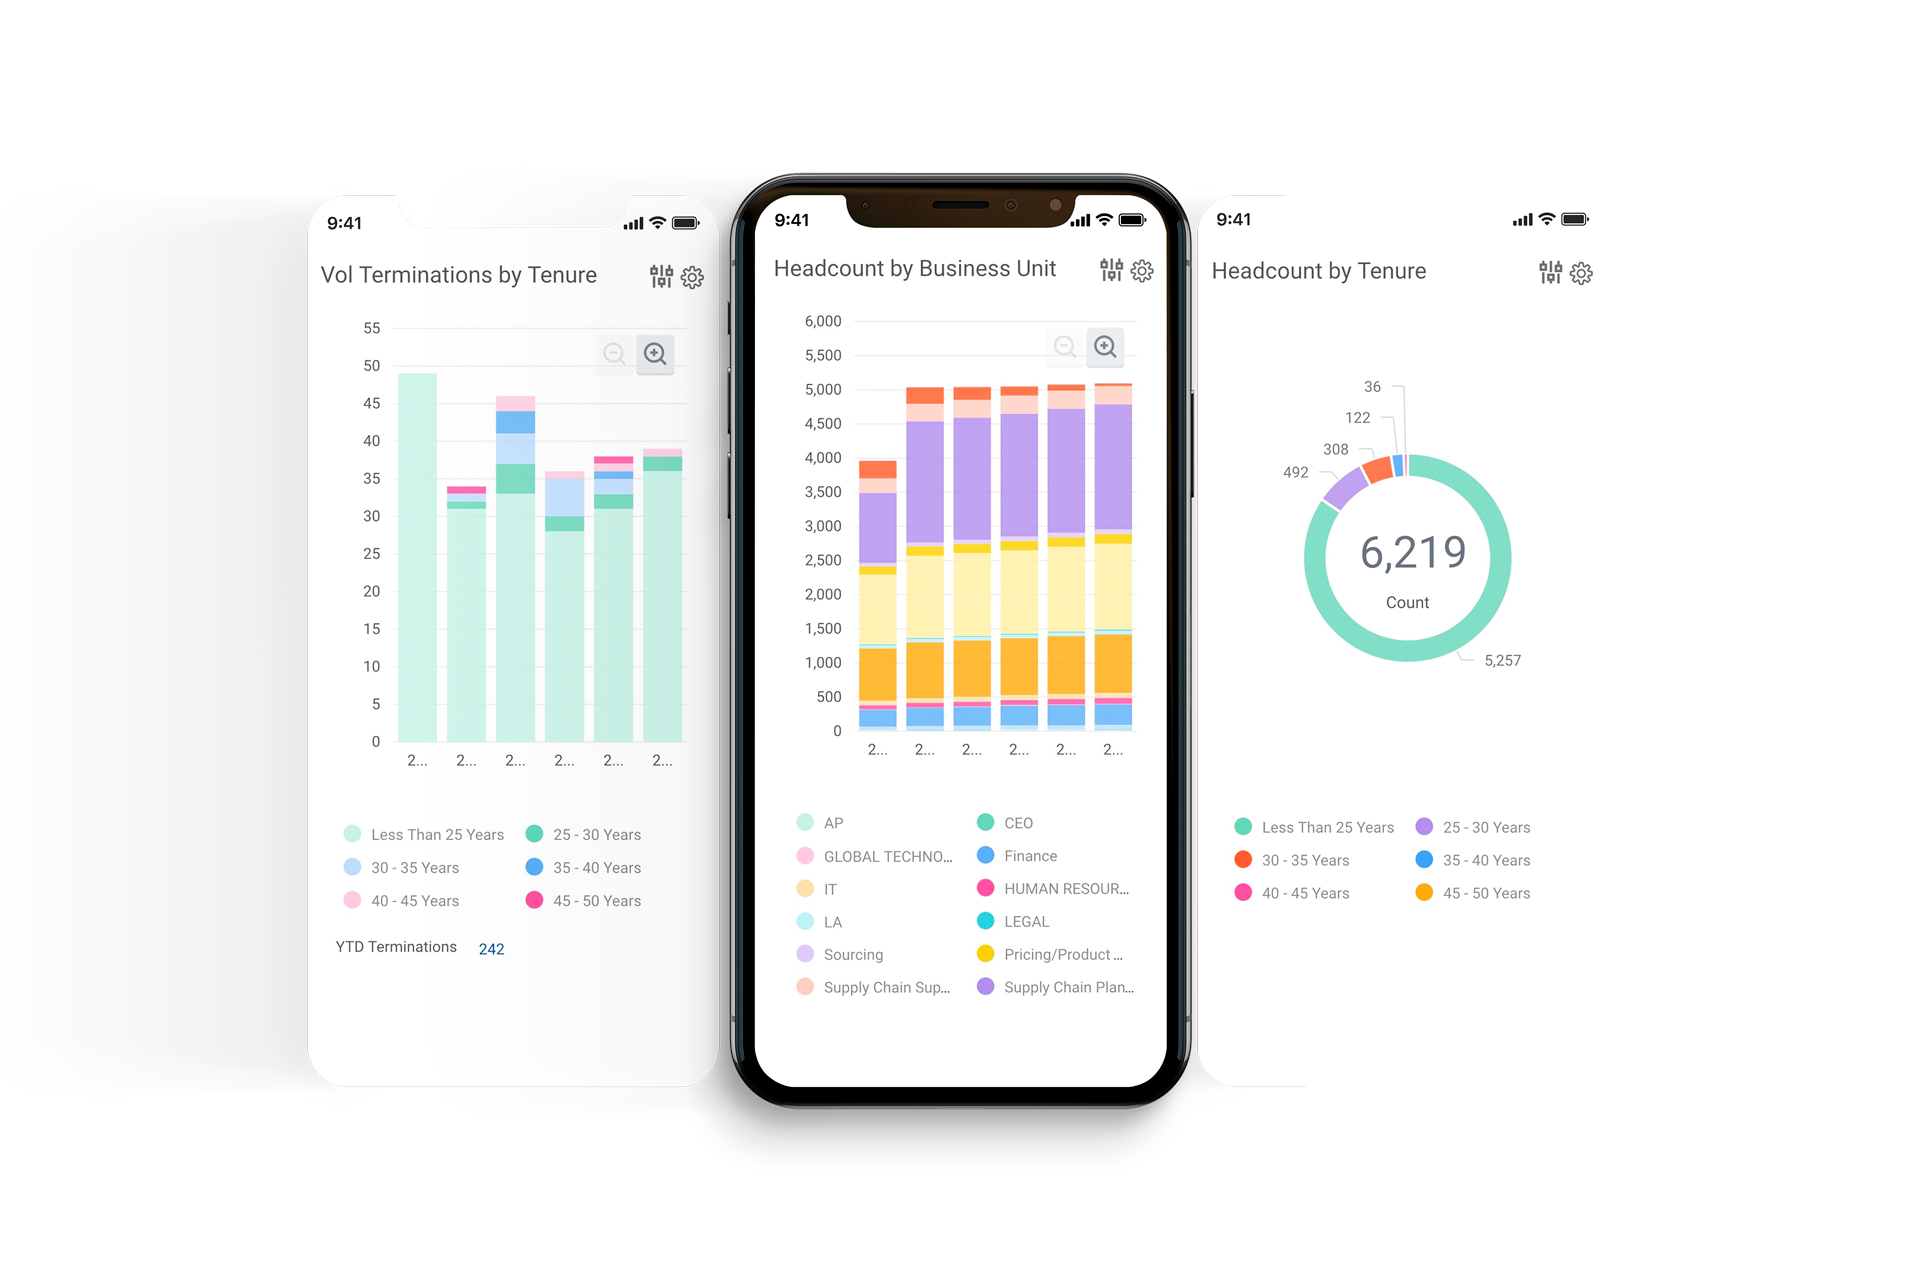
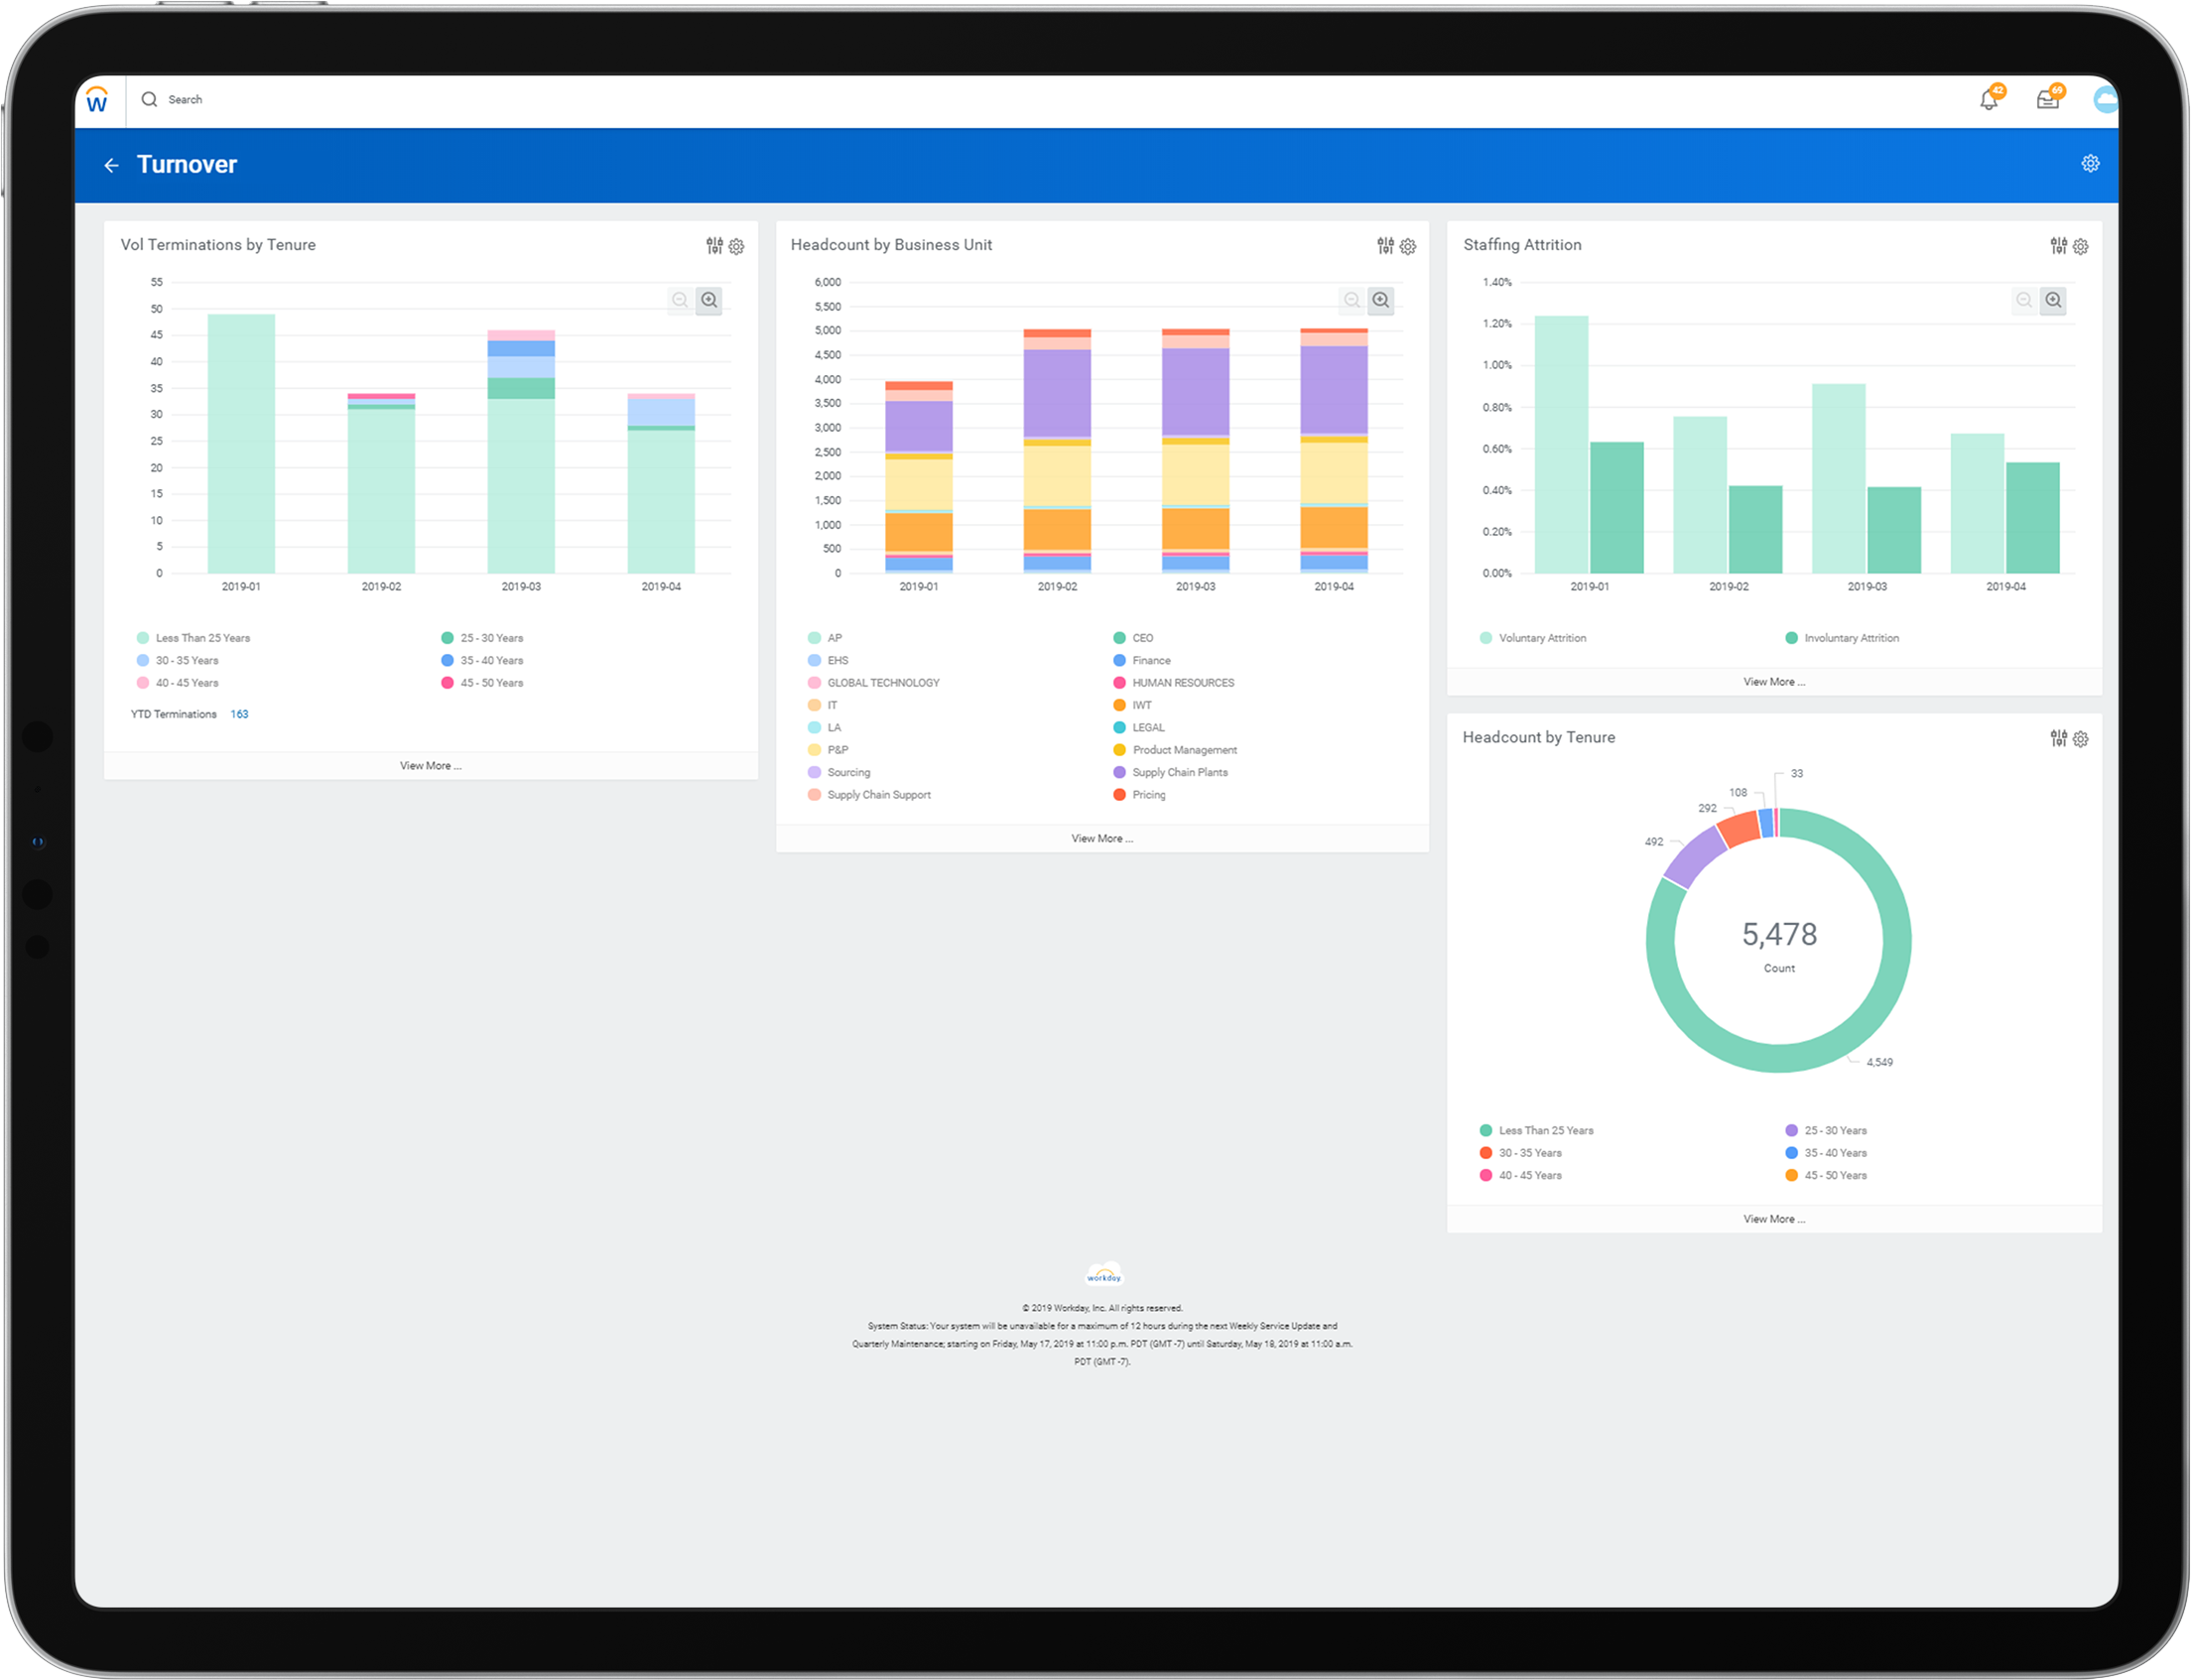
Turnover metrics, along with many other measurable data, can take on numerous visual representations. Factors such as the general end user, periodic usage, and resulting organizational action and internal accountability are areas to consider before development.
Financial reporting
Composite Reporting in Workday brings financial data from multiple sources into one clear, formatted report. It allows finance teams to present consistent, leadership-ready insights that support better decision-making and improve visibility into organizational performance.